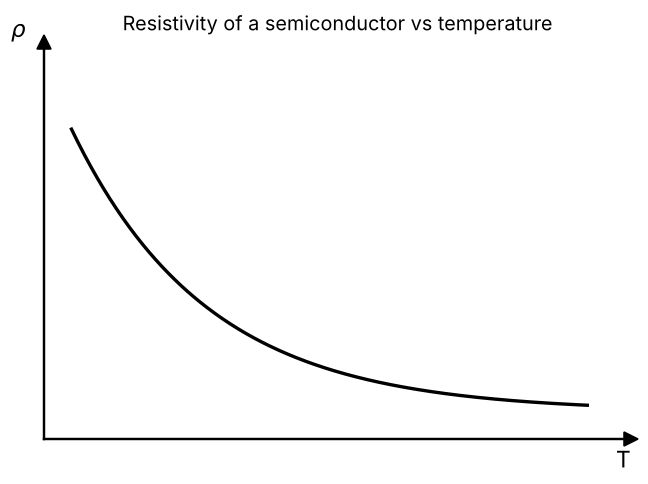
Show, on a graph, the variation of resistivity with temperature for a typical semiconductor.
Answer: The resistivity of a semiconductor \emph{decreases} with rising temperature: a curve falling (exponentially) with T.
Solution
In a semiconductor the number density n of charge carriers rises rapidly with temperature as covalent bonds break, and since ρ∝1/n, the resistivity falls as T increases.