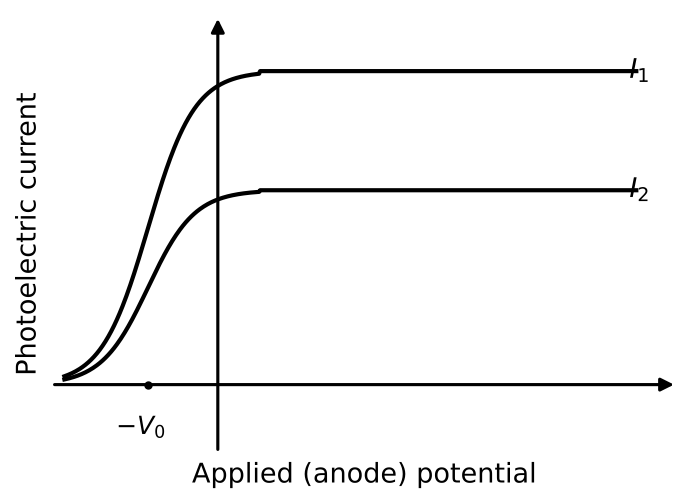
Draw graphs showing the variation of photoelectric current with applied voltage for two incident radiations of equal frequency and different intensities. Mark the graph for the radiation of higher intensity.
Answer: Same stopping potential; curve with higher saturation current (I1) is the higher intensity.
Solution
For a fixed frequency the stopping potential is the same for both intensities, so both curves meet the voltage axis at the same point −V0. A higher intensity means more photons and hence more photoelectrons, giving a larger saturation current. In the graph the upper curve (I1) corresponds to the higher intensity.
Same stopping potential; higher intensity ⇒ higher saturation current (I1)