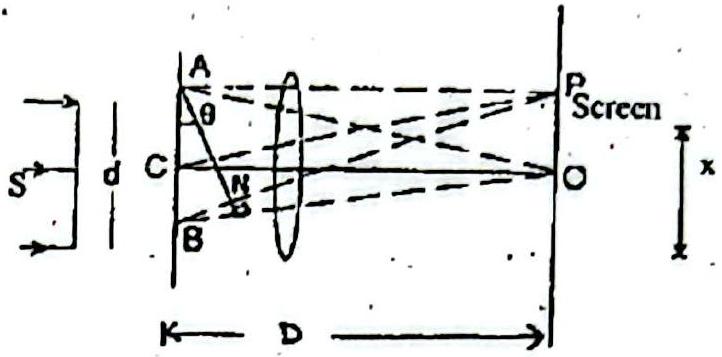
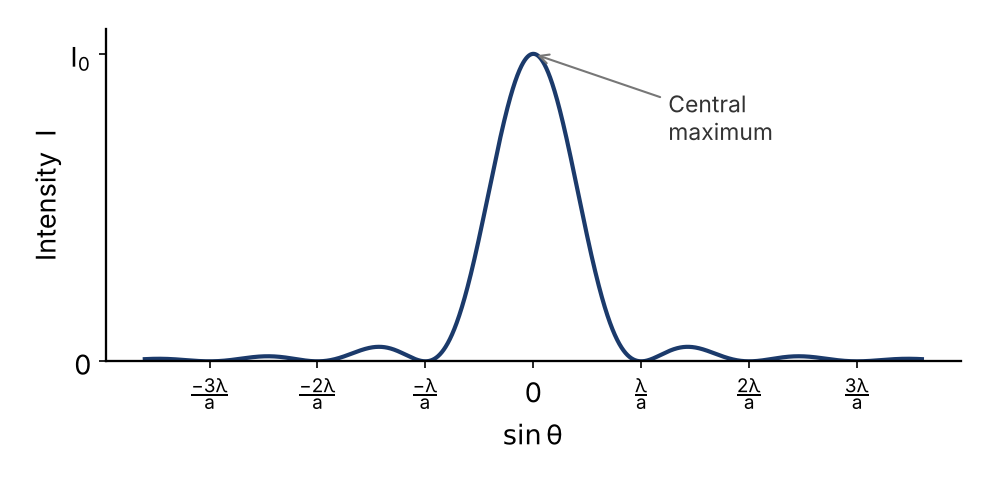
State Huygens' principle. Show, with the help of a suitable diagram, how this principle is used to obtain the diffraction pattern by a single slit. Draw a plot of the intensity distribution and explain clearly why the secondary maxima become weaker with increasing order (n) of the secondary maxima.
Solution
Huygens’ principle: (i) every point on a wavefront acts as a fresh source of secondary wavelets spreading out in all directions with the speed of light; (ii) the forward envelope of these wavelets gives the new wavefront at any later instant. Single-slit diffraction: a plane wavefront on a slit AB of width a sends secondary wavelets to a lens that focuses them on the screen. Along θ=0 all wavelets arrive in phase, giving the central maximum. For direction θ the edge-to-edge path difference is asinθ; minima occur at asinθ=nλ and secondary maxima at asinθ=(2n+1)2λ. The intensity plot shows a strong central peak with much weaker side maxima (see figure). Why secondary maxima weaken: at the first secondary maximum the slit can be divided into 3 equal strips, of which 2 cancel in pairs and only 1/3 contributes; at the next, 5 strips with only 1/5 contributing, and so on. Since a smaller and smaller fraction (31,51,71,…) of the wavefront is left uncancelled, the intensity of successive secondary maxima falls rapidly.