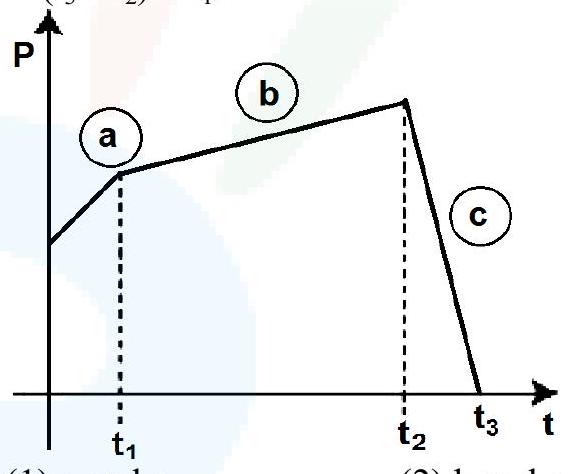
The figure represents the momentum time (p-t) curve for a particle moving along an axis under the influence of the force. Identify the regions on the graph where the magnitude of the force is maximum and minimum respectively? If (t3−t2)<t1.
(A)c and a
(B)b and c
(C)c and b✓ Correct
(D)a and b
Answer: (C)
Solution
The force on the particle is the rate of change of momentum, ∣F∣=dtdp, which is the steepness of the momentum-time graph. Region c, where the momentum falls sharply over the short interval t3−t2 (smaller than t1), has the steepest slope and hence the largest force, while the gently rising region b has the smallest slope and hence the least force. The force is greatest in region c and least in region b.
JEE Main · 2023 · 30 Jan 2023 · Shift 1 · Single correct option