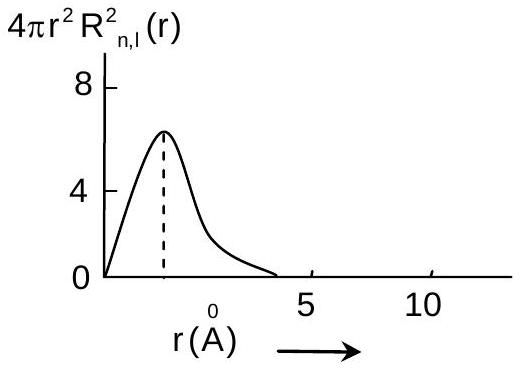
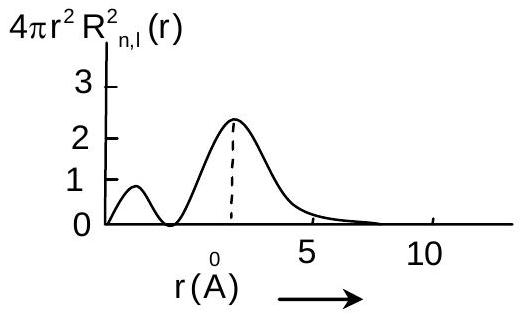
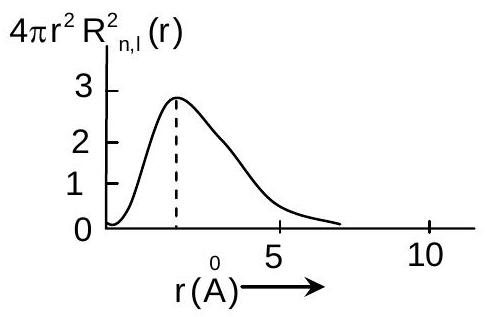
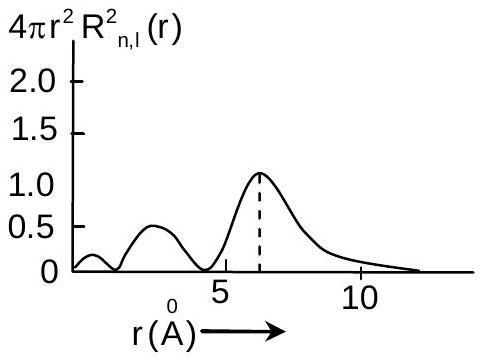
The Plots of radial distribution functions for various orbitals of hydrogen atom against 'r' are given below:
(a) (see plot) (b) (see plot) (c) (see plot) (d) (see plot)
The correct plot for 3s orbital is:abcd
(A)(d)✓ Correct
(B)(b)
(C)(a)
(D)(c)
Answer: (A)
Solution
A radial distribution curve for an orbital with quantum numbers n and ℓ touches zero at n−ℓ−1 radial nodes and so rises to n−ℓ maxima. For a 3s orbital n=3 and ℓ=0, giving two radial nodes and three maxima, with the outermost maximum much the largest and standing farthest from the nucleus. The curve with two small inner humps followed by a dominant peak near 7 angstrom is plot (d).
JEE Main · 2021 · 25 Feb 2021 · Shift 1 · Single correct option