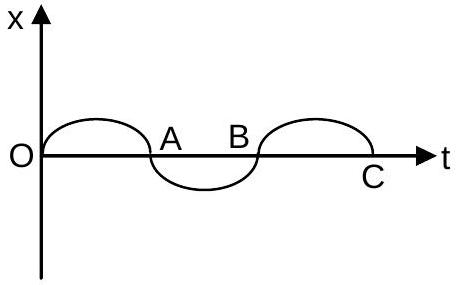
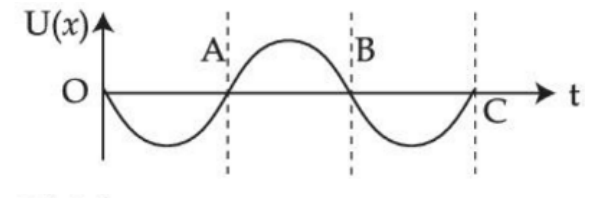
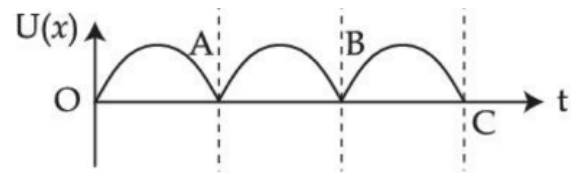
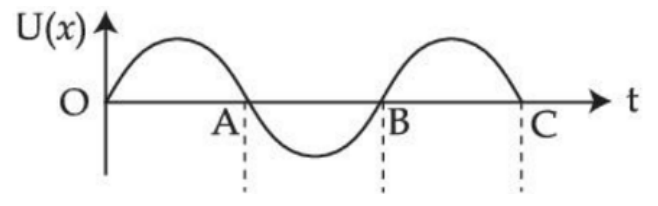
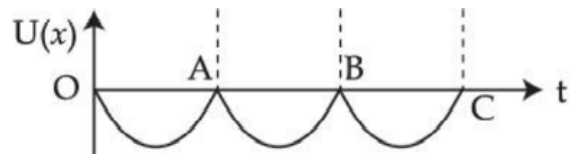
The variation of displacement with time of a particle executing free simple harmonic motion is shown in the figure. The potential energy U(x) versus time (t) plot of the particle is correctly shown in figure :
(A)(see structure)
(B)(see structure)✓ Correct
(C)(see structure)
(D)(see structure)
Answer: (B)
Solution
The displacement is sinusoidal with x=0 at t=0, so the potential energy U=21kx2 begins at zero, rises to a maximum each time the particle reaches an extreme position, and falls back to zero whenever the displacement is zero. Because U∝x2 it is never negative, so its graph is a succession of identical positive humps that touch the time axis at t=0 and at every later instant the displacement vanishes, with period half that of the displacement. The correct plot shows these non-negative humps meeting the axis at the marked points.
JEE Main · 2021 · 27 Aug 2021 · Shift 1 · Single correct option