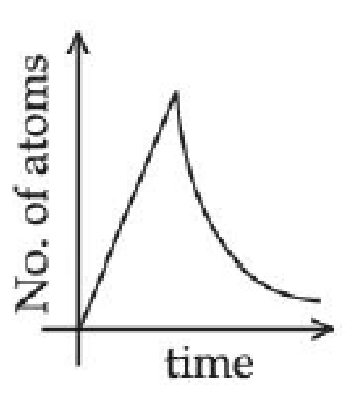
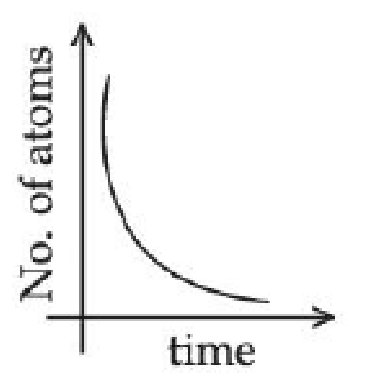
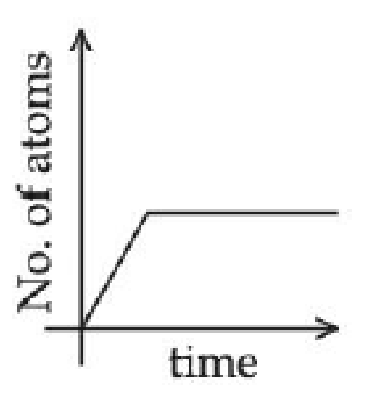
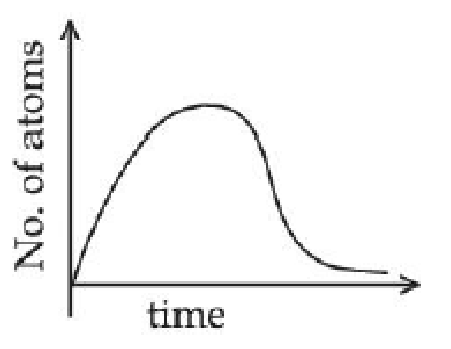
A sample of a radioactive nucleus A disintegrates to another radioactive nucleus B , which in turn disintegrates to some other stable nucleus C . Plot of a graph showing the variation of number of atoms of nucleus B vesus time is : (Assume that at t=0, there are no B atoms in the sample)
(A)(see structure)
(B)(see structure)✓ Correct
(C)(see structure)
(D)(see structure)
Answer: (B)
Solution
In a radioactive decay chain A→B→C where B is also radioactive, the number of B atoms first increases as A decays, reaches a maximum, then decreases as B decays to C. The graph shows a rise to a peak followed by exponential decay. Option (B) correctly shows this behavior.
JEE Main · 2021 · 31 Aug 2021 · Shift 1 · Single correct option