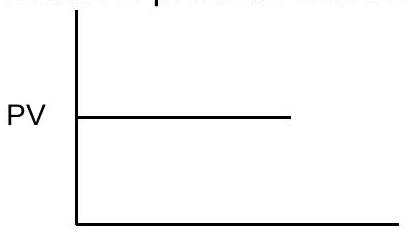
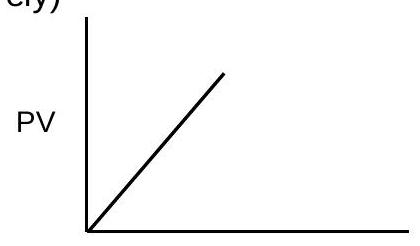
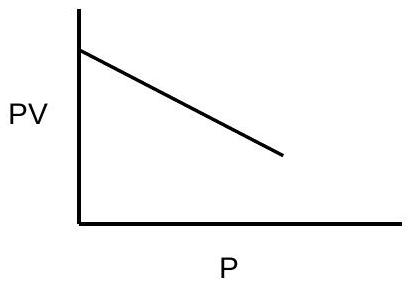
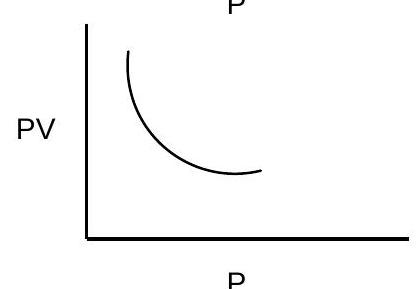
Which one of the following is the correct PV vs P plot at constant temperature for an ideal gas? ( P and V stand for pressure and volume of the gas respectively)
(A)(see graph)✓ Correct
(B)(see graph)
(C)(see graph)
(D)(see graph)
Answer: (A)
Solution
At constant temperature an ideal gas obeys PV=nRT, a constant that is independent of the pressure. A plot of PV against P is therefore a straight line parallel to the pressure axis. The correct graph is a horizontal line of constant PV.
JEE Main · 2021 · 31 Aug 2021 · Shift 1 · Single correct option