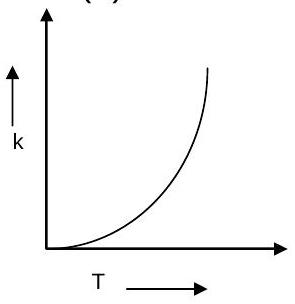
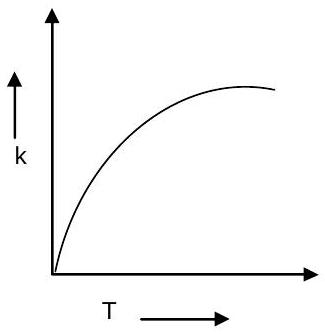
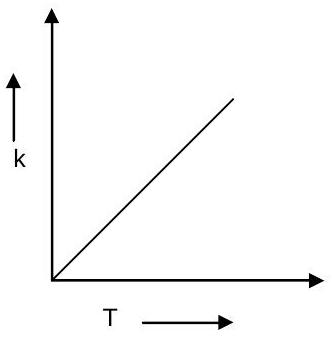
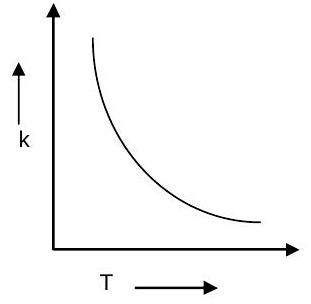
Which one of the following given graphs represents the variation of rate constant (k) with temperature (T) for an endothermic reaction?
(A)(see structure)✓ Correct
(B)(see structure)
(C)(see structure)
(D)(see structure)
Answer: (A)
Solution
By the Arrhenius equation k=Ae−Ea/RT, raising the temperature drives the exponential term towards unity, so the rate constant increases with temperature for every reaction, endothermic or exothermic alike. The plot of k against T is a curve that rises ever more steeply, an exponential increase.
JEE Main · 2021 · 01 Sep 2021 · Shift 2 · Single correct option