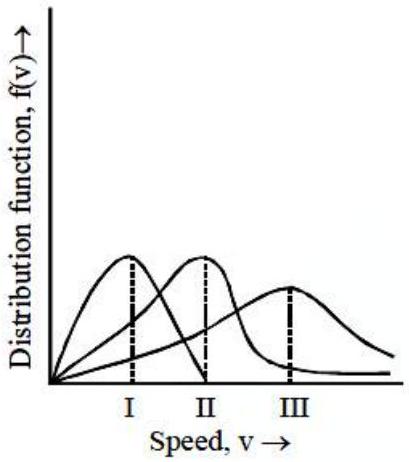
Points I, II and III in the following plot respectively correspond to ( Vmp : most probable velocity)
(A)Vmp of N2(300K) ; Vmp of H2(300K) ; Vmp of O2(400K)
(B)Vmp of H2(300K) ; Vmp of N2(300K) ; Vmp of O2(400K)
(C)Vmp of O2(400K) ; Vmp of N2(300K) ; Vmp of H2(300K)
(D)Vmp of N2(300K) ; Vmp of O2(400K) ; Vmp of H2(300K)✓ Correct
Answer: (D)
Solution
The most probable speed is Vmp=M2RT, so it scales as T/M. For nitrogen at 300K this is 300/28≈3.3, for oxygen at 400K it is 400/32≈3.5, and for the very light hydrogen at 300K it is 300/2≈12.3. Reading the plot from the slowest peak to the fastest, the three points belong to NX2 at 300K, then OX2 at 400K, then HX2 at 300K.
JEE Main · 2019 · 10 Apr 2019 · Shift 2 · Single correct option