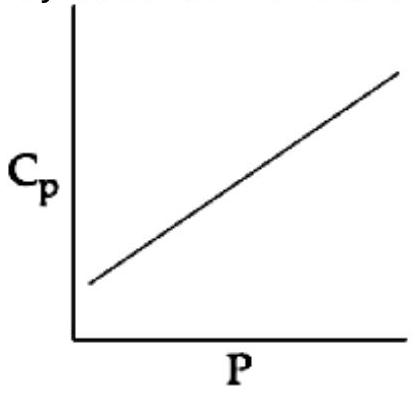
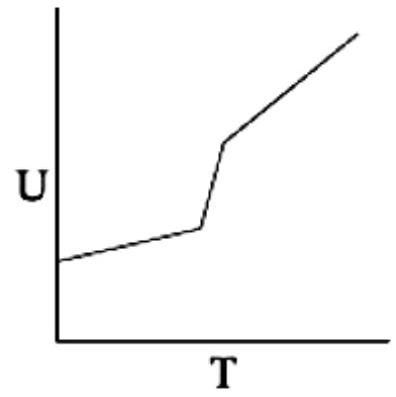
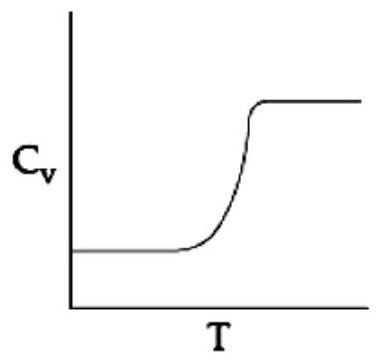
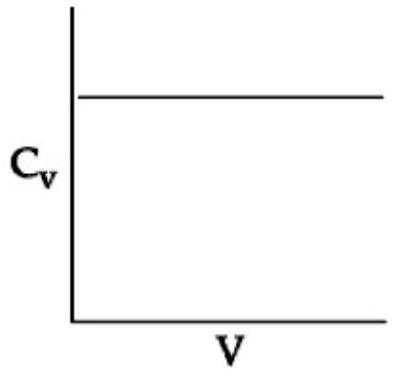
For a disatomic ideal gas in a closed system, which of the following plots does not correctly describe the relation between various thermodynamic quantities?
(A)(see structure)
(B)(see structure)
(C)(see structure)✓ Correct
(D)(see structure)
Answer: (C)
Solution
For an ideal gas the molar heat capacity at constant pressure, CP, is set only by the temperature and the molecule's degrees of freedom; it does not change when the pressure is varied at fixed temperature. A graph that shows CP rising or falling with pressure therefore misrepresents the behaviour of an ideal gas, so that is the plot which does not correctly describe the relationship.
JEE Main · 2019 · 12 Jan 2019 · Shift 1 · Single correct option