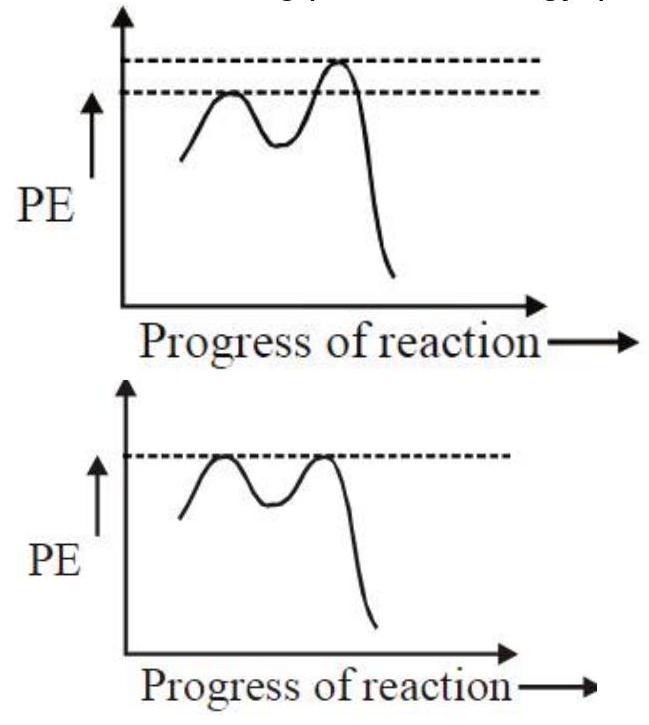
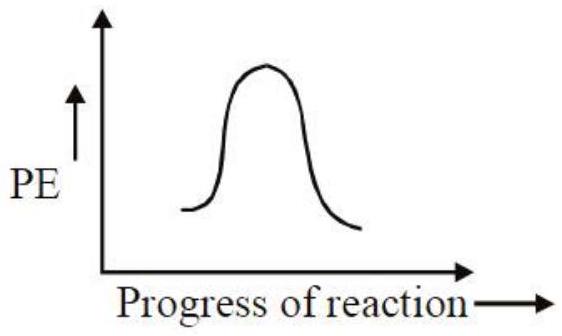
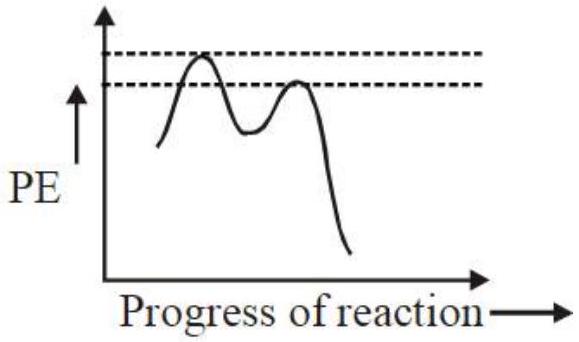
Which of the following potential energy (PE) diagrams represents the SN1 reaction?
(A)(see structure)
(B)(see structure)
(C)(see structure)
(D)(see structure)✓ Correct
Answer: (D)
Solution
An SN1 reaction proceeds in two steps through a carbocation intermediate, so its energy profile shows two maxima separated by a shallow minimum. The first step, ionisation to form the carbocation, is rate-determining and therefore carries the higher barrier, so the correct profile is the one whose first hump is taller than the second with a dip between them.
JEE Main · 2019 · 09 Apr 2019 · Shift 2 · Single correct option