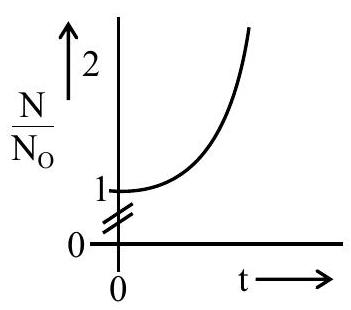
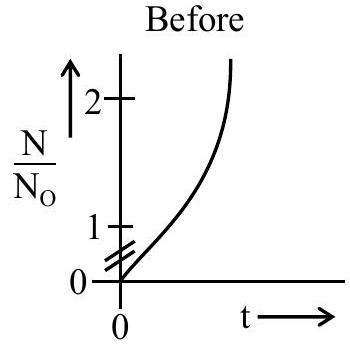
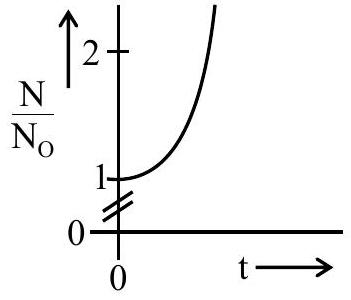
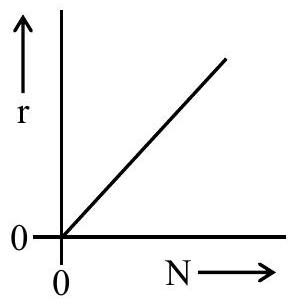
A person's wound was exposed to some bacteria and then bacteria growth started to happen at the same place. The wound was later treated with some antibacterial medicine and the rate of bacterial decay (r) was found to be proportional with the square of the existing number of bacteria at any instance. Which of the following set of graphs correctly represents the 'before' and 'after' situation of the application of the medicine? [Given : N= No. of bacteria, t= time, bacterial growth follows Ist order kinetics.]
(A)(see structure)
(B)(see structure)✓ Correct
(C)(see structure)
(D)(see structure)
Answer: (B)
Solution
Before the medicine the population grows by first-order kinetics, dtdN=kN, which integrates to N=N0ekt, an exponential rise of number with time. After the medicine the decay rate varies as the square of the number present, r=kN2, so a graph of rate against number of bacteria is a parabola rising from the origin. The correct pair shows exponential growth of population with time followed by a parabolic dependence of decay rate on the number of bacteria.
JEE Main · 2025 · 07 Apr 2025 · Shift 1 · Single correct option