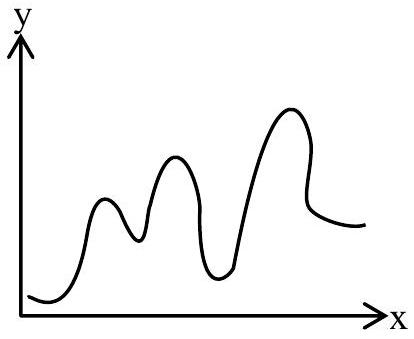
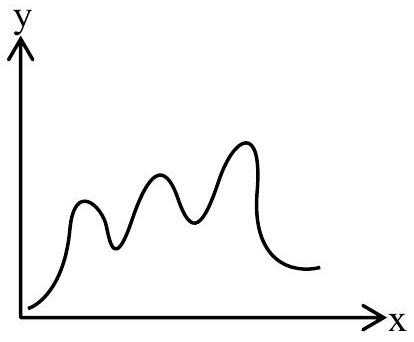
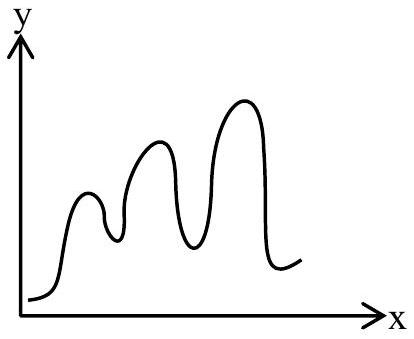
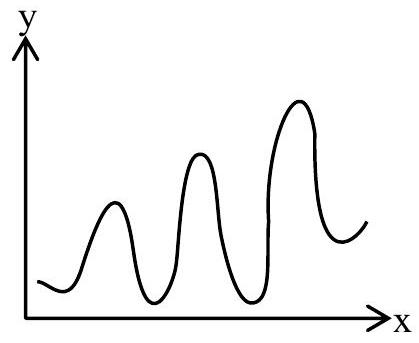
A→D is an endothermic reaction occurring in three steps (elementary). (i) A→BΔHi=+ve (ii) B→CΔHii=−ve (iii) C→DΔHiii =−ve
Which of the following graphs between potential energy ( y -axis) vs reaction coordinate ( x -axis) correctly represents the reaction profile of A→D ?
(A)(see structure)
(B)(see structure)
(C)(see structure)✓ Correct
(D)(see structure)
Answer: (C)
Solution
The overall change A→D is endothermic, so the product D must lie above the reactant A. Step by step, A→B with ΔH>0 raises the energy to the highest intermediate B; B→C with ΔH<0 lowers it to C; and C→D with ΔH<0 lowers it further to D. The correct profile shows three maxima, the intermediate minima decreasing in the order B>C>D, with A the lowest point and D still above A. The graph that reproduces this ordering is the required reaction profile.
JEE Main · 2026 · 24 Jan 2026 · Shift 1 · Single correct option