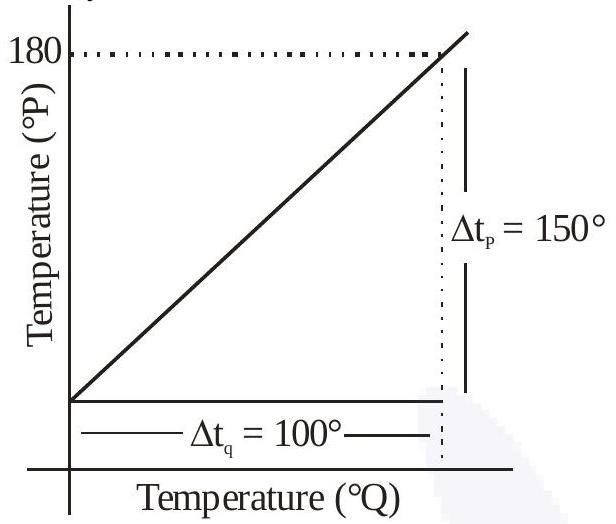
The graph between two temperature scales P and Q is shown in the figure. Between upper fixed point and lower fixed point there are 150 equal divisions of scale P and 100 divisions on scale Q . The relationship for conversion between the two scales is given by :
(A)150tQ=100tP−180
(B)100tQ=150tP−30✓ Correct
(C)180tP=100tQ−40
(D)100tp=150tQ−180
Answer: (B)
Solution
The two scales share their lower and upper fixed points, so equal fractions of the interval between those points read the same temperature. Scale P runs from 30∘ to 180∘, a span of 150 divisions, while scale Q runs from 0∘ to 100∘, a span of 100 divisions. Equating the fractional rise above each lower point gives 150tP−30=100tQ, which rearranges to the conversion 100tQ=150tP−30.
JEE Main · 2023 · 25 Jan 2023 · Shift 2 · Single correct option