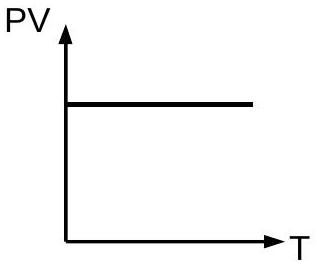
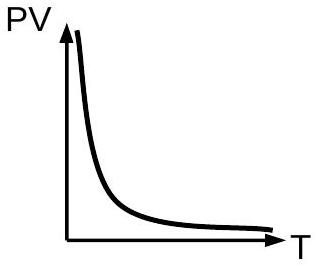
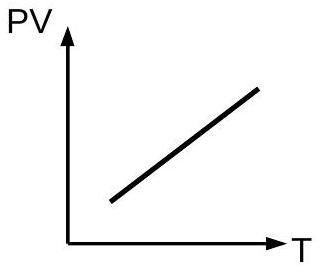
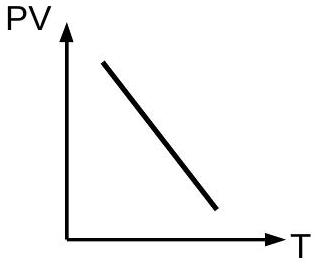
Which of the following graphs represent the behaviour of an ideal gas? Symbols have their usual meaning.
(A)(see structure)
(B)(see structure)
(C)(see structure)✓ Correct
(D)(see structure)
Answer: (C)
Solution
An ideal gas obeys PV=nRT, so for a fixed amount of gas the product PV is directly proportional to the absolute temperature with the constant of proportionality nR. Neither P nor V alone is fixed here, but their product is tied to T by that single constant, so a graph of PV against T is a rising straight line of slope nR passing through the origin.
JEE Main · 2021 · 20 Jul 2021 · Shift 2 · Single correct option