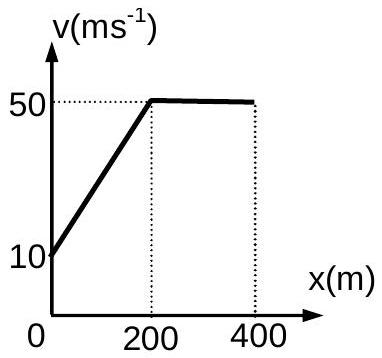
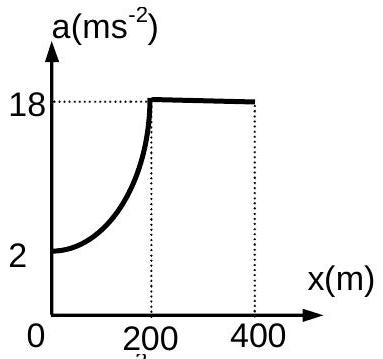
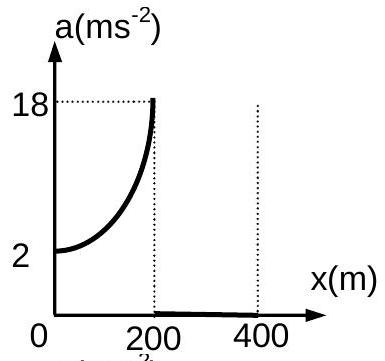
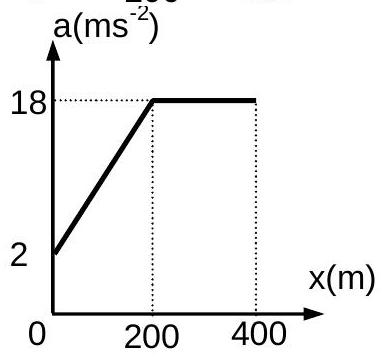
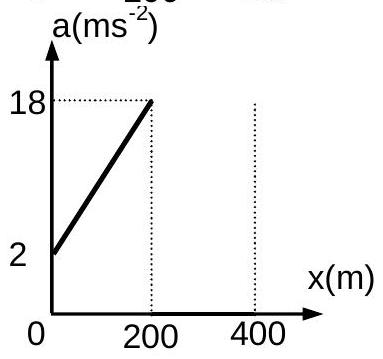
The velocity- displacement graph describing the motion of a bicycle is shown in the figure. The acceleration-displacement graph of the bicycle's motion is best described by:
(A)(see structure)
(B)(see structure)
(C)(see structure)
(D)(see structure)✓ Correct
Answer: (D)
Solution
The velocity-displacement graph rises from 10ms−1 at the origin to 50ms−1 at x=200 m and then stays flat, so
v=10+5x(0≤x≤200m),v=50(200<x≤400m)
Acceleration along a straight path follows from a=vdxdv. On the sloping stretch dxdv=51, so
a=(10+5x)51=2+25x
which is a straight line of positive slope starting at 2ms−2. Beyond x=200 m the speed no longer changes, dxdv=0, and the acceleration falls to zero. The acceleration-displacement graph is a straight line rising from 2ms−2 over the first 200 m, dropping abruptly to zero there and staying at zero out to 400 m.
JEE Main · 2021 · 16 Mar 2021 · Shift 1 · Single correct option