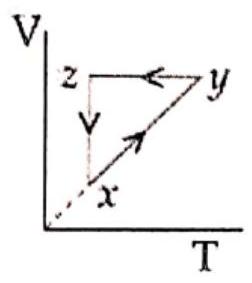
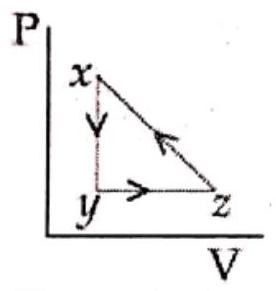
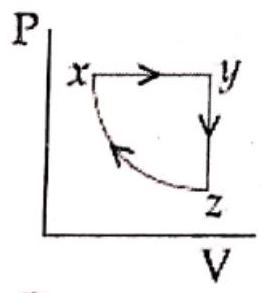
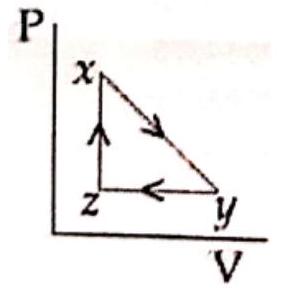
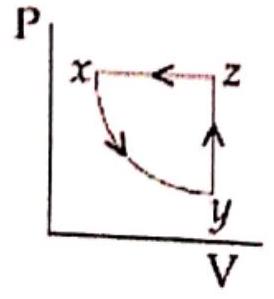
A thermodynamic cycle xyzx is shown on a V-T diagram. The P-V diagram that best describes this cycle is: (diagrams are schematic and not to scale)
(A)(see structure)
(B)(see structure)✓ Correct
(C)(see structure)
(D)(see structure)
Answer: (B)
Solution
Reading the cycle off the given V-T diagram, the step x→y is an expansion at constant temperature, so on a P-V diagram it is a falling hyperbola as the pressure drops. The step y→z keeps the volume fixed while the temperature rises, which on the P-V plane is a vertical line of increasing pressure. The closing step z→x brings both volume and temperature down together, tracing a line back to the starting state. Applying PV=nRT to each leg, the pressure-volume picture is a decreasing isotherm, then a vertical pressure rise at constant volume, then a straight return to the initial point.
JEE Main · 2020 · 08 Jan 2020 · Shift 1 · Single correct option