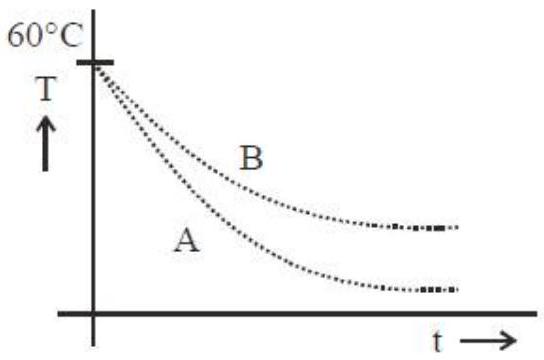
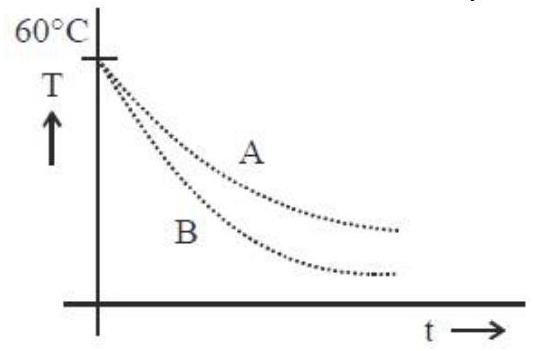
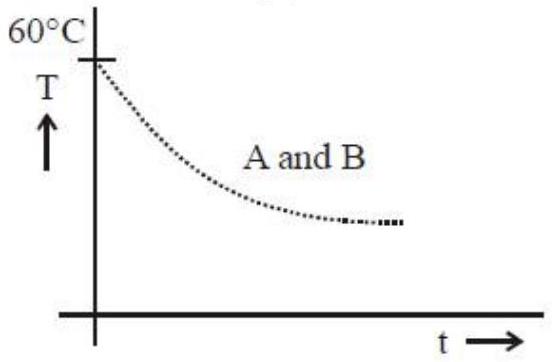
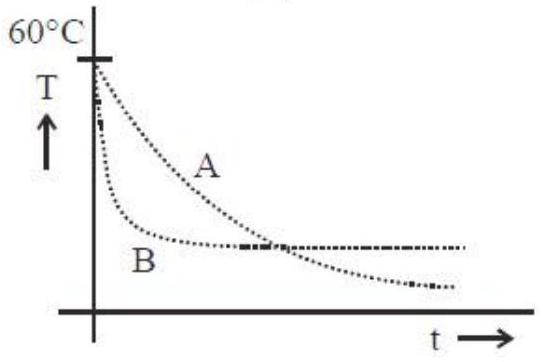
Two identical beakers A and B contain equal volumes of two different liquids at 60∘C each and left to cool down. Liquid in A has density of 8×10²kg/m3 and specific heat of 2000Jkg−1K−1 while liquid in B has density of 103kgm−3 and specific heat of 4000JKg−1K−1. Which of the following best describes their temperature versus time graph schematically? (assume the emissivity of both the beakers to be the same)
(A)(see structure)✓ Correct
(B)(see structure)
(C)(see structure)
(D)(see structure)
Answer: (A)
Solution
Both beakers radiate from the same surface, so the rate at which the temperature falls is set by the heat capacity per unit volume, dtdT∝ρs1. For liquid A, ρs=8×102×2000=1.6×10⁶, while for liquid B, ρs=103×4000=4×10⁶. Because A has the smaller ρs, its temperature drops faster, so its cooling curve falls more steeply from the common start at 60∘C. The graph in which A cools faster than B is the correct description.
JEE Main · 2019 · 08 Apr 2019 · Shift 1 · Single correct option