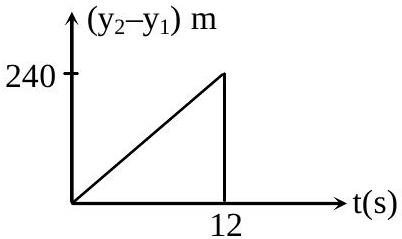
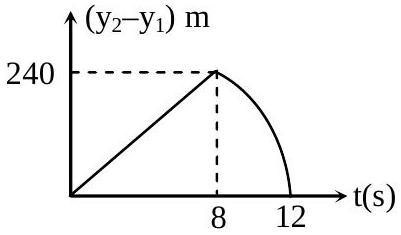
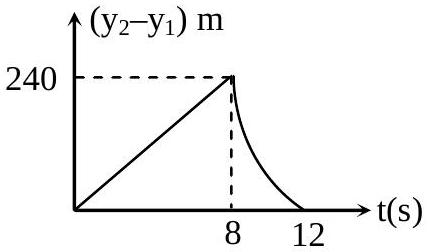
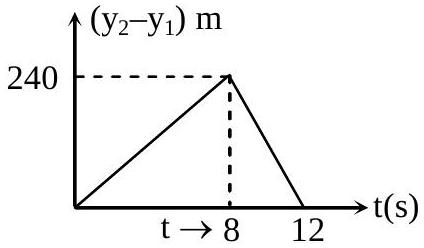
Two stones are thrown up simultaneously from the edge of a cliff 240 m high with initial speed of 10m/s and 40m/s respectively. Which of the following graph best represents the time variation of relative position of the second stone with respect to the first ? (Assume stones do not rebound after hitting the ground and neglect air resistance, take g=10m/s2) (The figures are schematic and not drawn to scale)
(A)(see structure)
(B)(see structure)✓ Correct
(C)(see structure)
(D)(see structure)
Answer: (B)
Solution
While both stones are airborne each falls under the same gravity, so the −21gt2 terms cancel and the gap between them is y2−y1=(40−10)t=30t -- a straight line climbing steadily. This lasts only until the slower stone, launched at 10m/s, reaches the ground and stops; after that one stone is pinned at the cliff base while the faster stone keeps accelerating downward, so the separation stops growing linearly and bends into a curve. The right graph rises as a straight line and then turns over into a parabola.
JEE Main · 2015 · 04 Apr 2015 · Offline · Single correct option