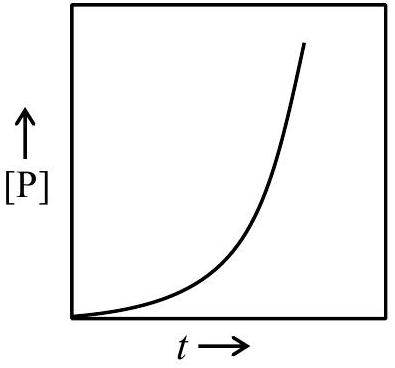
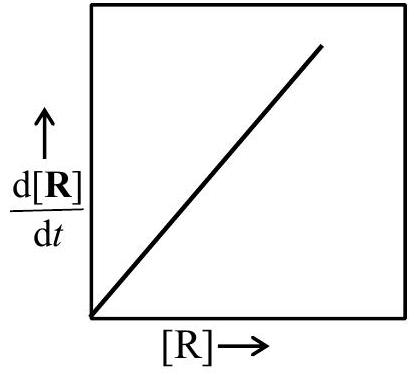
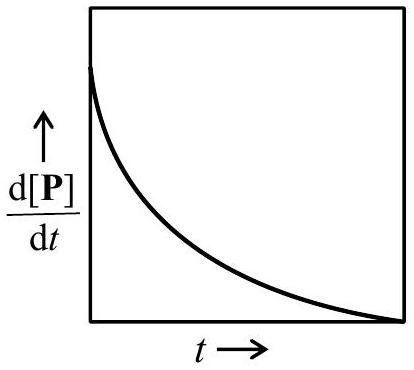
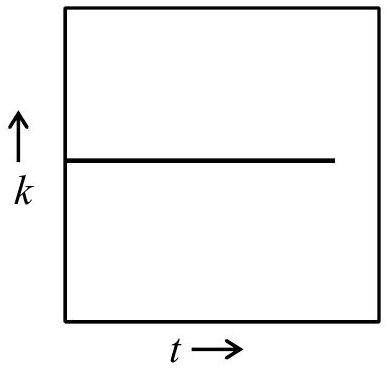
For a first-order reaction R→P at a given temperature, k is the rate constant. For this reaction, at the given temperature, the concentrations of R and P at a time t are [R] and [P], respectively. The correct graphical representation(s) for this reaction is(are)
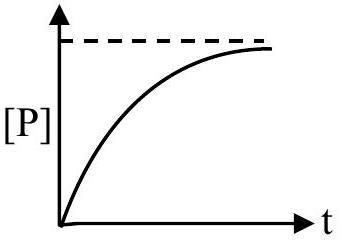
(A)(see structure)
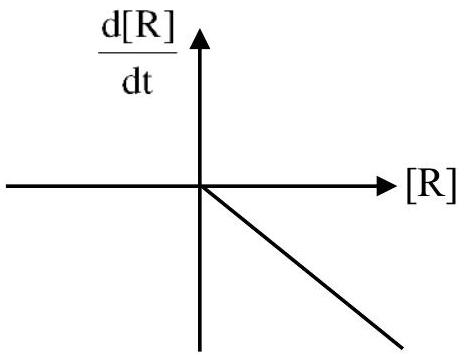
(B)(see structure)
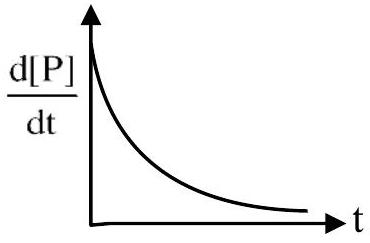
(C)(see structure)✓ Correct
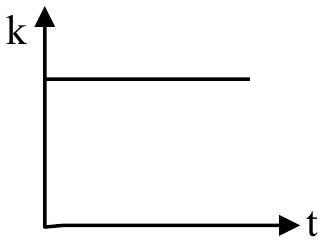
(D)(see structure)✓ Correct
Answer: (C), (D)
Solution
For a first-order reaction R→P:
Option (A): [P]t=[R]0(1−e−kt) shows an exponential rise, not a straight line. Incorrect.
Option (B): dtd[R]=−k[R] means the rate vs [R] plot should pass through origin with negative slope. The graph shown doesn't match. Incorrect.
Option (C): Rate =dtd[P]=k[R]0e−kt. This shows an exponential decay of rate with time, which is correct for a first-order reaction.
Option (D): For a first-order reaction, k is constant and independent of concentration or time. A horizontal line at constant k is correct.
Therefore, options (C) and (D) are correct.
JEE Advanced · 2026 · 17 May 2026 · Paper 2 · One or more correct options