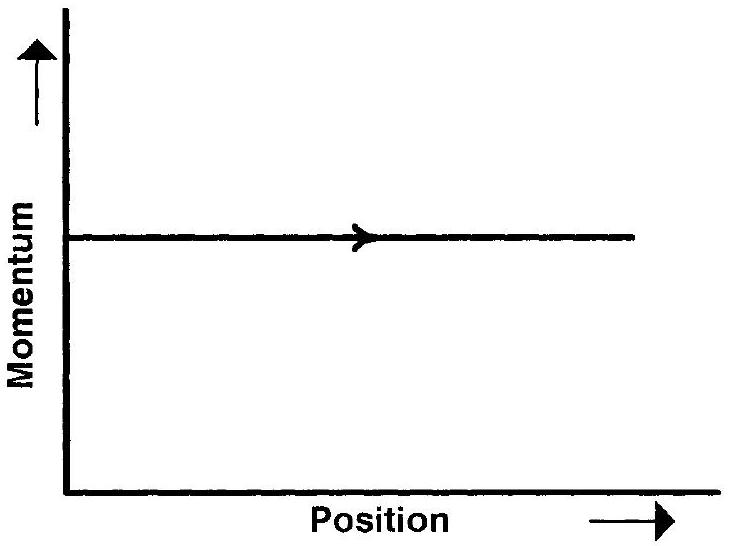
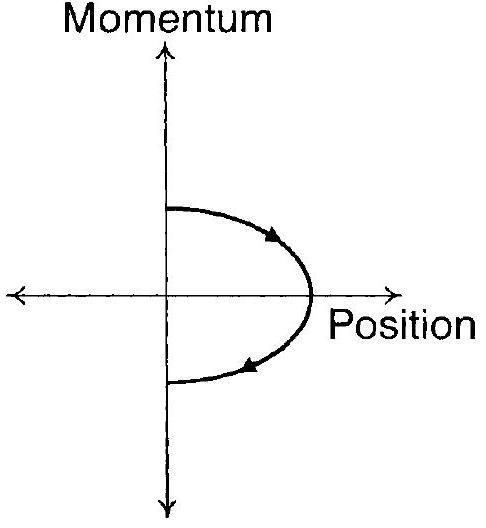
Phase space diagrams are useful tools in analyzing all kinds of dynamical problems. They are especially useful in studying the changes in motion as initial position and momentum are changed. Here we consider some simple dynamical systems in one-dimension. For such systems, phase space is a plane in which position is plotted along horizontal axis and momentum is plotted along vertical axis. The phase space diagram is x(t) vs. p(t) curve in this plane. The arrow on the curve indicates the time flow. For example, the phase space diagram for a particle moving with constant velocity is a straight line as shown in the figure. We use the sign convention in which position or momentum upwards (or to right) is positive and downwards (or to left) is negative.
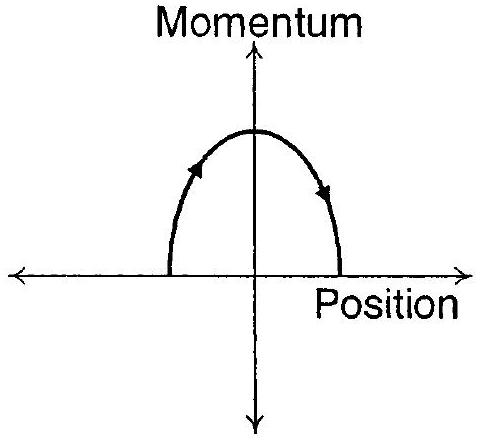
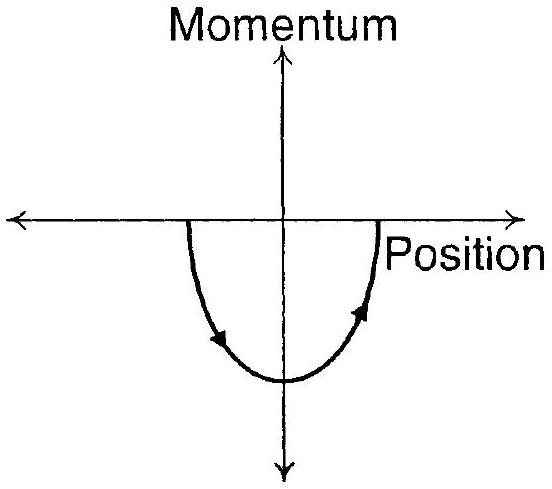
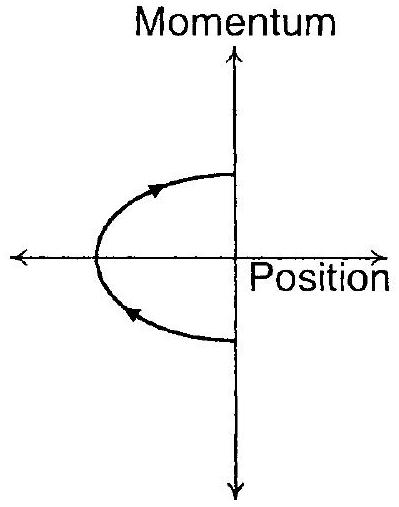
The phase space diagram for a ball thrown vertically up from ground is
(A)(see structure)
(B)(see structure)
(C)(see structure)
(D)(see structure)✓ Correct
Answer: (D)
Solution
For a ball thrown vertically upward:
Initially at ground (x=0) with positive momentum (upward)
As it rises, x increases while momentum decreases linearly (p = mv - mgt)
At maximum height, momentum becomes zero
Then momentum becomes negative (downward) as ball falls
Returns to ground with negative momentum
This traces a parabolic path in phase space, starting at origin with positive p, reaching maximum x at p=0, and returning to x=0 with negative p. Option (D) shows this correct parabolic trajectory.
JEE Advanced · 2011 · 10 Apr 2011 · Paper 1 · Single correct option