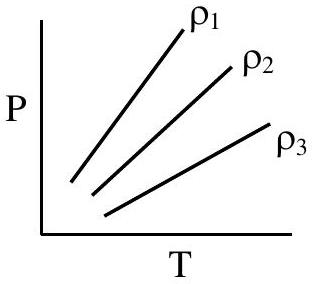
P-T diagram of an ideal gas having three different densities ρ1,ρ2,ρ3 (in three different cases) is shown in the figure. Which of the following is correct :
(A)ρ2<ρ3
(B)ρ1>ρ2✓ Correct
(C)ρ1<ρ2
(D)ρ1=ρ2=ρ3
Answer: (B)
Solution
For an ideal gas, PV=MmRT, so
P=MρRT.
On a P–T diagram each density is a straight line through the origin with slope MρR; a steeper line means larger density. At any fixed temperature, the curve with the greater pressure has the greater density, so from the figure
ρ1>ρ2>ρ3.
In particular ρ1>ρ2⇒ option B.
JEE Main · 2024 · 04 Apr 2024 · Shift 1 · Single correct option