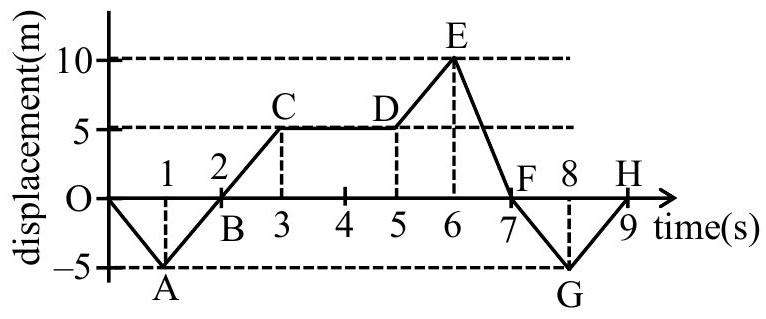
The displacement x versus time graph is shown below. (A) The average velocity during 0 to 3 s is 10m/s (B) The average velocity during 3 to 5 s is 0m/s (C) The instantaneous velocity at t=2s is 5m/s (D) The average velocity during 5 to 7 s and instantaneous velocity at t=6.5s are equal (E) The average velocity from t=0 to t=9s is zero
Choose the correct answer from the options given below:
(A)(A), (D), (E) only
(B)(B), (C), (D) only
(C)(B), (D), (E) only
(D)(B), (C), (E) only✓ Correct
Answer: (D)
Solution
Reading displacements from the graph, the line from t=1 s to t=3 s rises straight from −5 m to 5 m, so its slope is 3−15−(−5)=5 m/s. The average velocity from 0 to 3 s is 35−0=35 m/s, not 10 m/s, so that claim fails. Between 3 s and 5 s the displacement stays at 5 m, giving an average velocity 25−5=0, which is correct. At t=2 s the instantaneous velocity is the slope of the line through that instant, 5 m/s, which is correct. From 5 s to 7 s the displacement falls from 5 m to 0, an average velocity of −2.5 m/s, while at t=6.5 s the slope of the steep fall from 10 m to 0 is −10 m/s, so these two are unequal and that claim fails. Over 0 to 9 s the displacement returns to zero, making the average velocity 90−0=0, which is correct. The correct statements are (B), (C) and (E).
JEE Main · 2025 · 04 Apr 2025 · Shift 2 · Single correct option