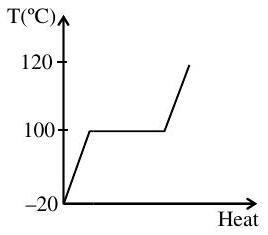
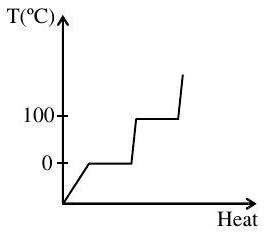
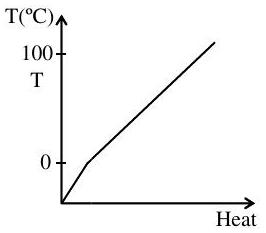
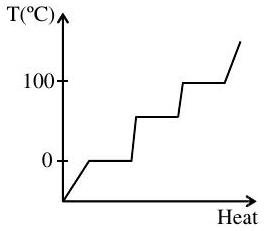
Which of the following best represents the temperature versus heat supplied graph for water, in the range of −20∘C to 120∘C?
(A)(see structure)
(B)(see structure)✓ Correct
(C)(see structure)
(D)(see structure)
Answer: (B)
Solution
Supplying heat to ice at −20∘C first raises its temperature along a sloped line up to 0∘C. At 0∘C the ice melts, absorbing the latent heat of fusion at constant temperature, which appears as a horizontal plateau. The water formed then warms from 0∘C to 100∘C along a second sloped line. At 100∘C the water boils at constant temperature, giving a second horizontal plateau, after which the steam warms above 100∘C. The correct temperature-versus-heat graph is the one showing exactly two horizontal plateaus, at 0∘C and at 100∘C, joined by sloped segments.
JEE Main · 2026 · 28 Jan 2026 · Shift 1 · Single correct option