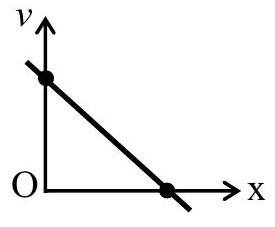
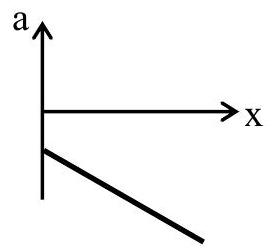
The velocity (v) - Distance (x) graph is shown in figure. Which graph represents acceleration (a) versus distance ( x ) variation of this system?
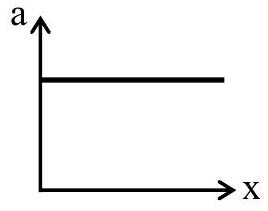
(A)(see graph)
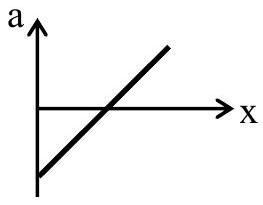
(B)(see graph)✓ Correct
(C)(see graph)
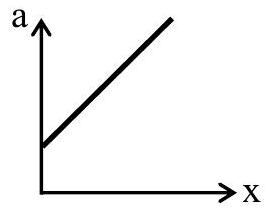
(D)(see graph)
Answer: (B)
Solution
The velocity-distance graph is a straight line of negative slope, v=v0−kx with k>0. Acceleration along the path is a=vdxdv=(v0−kx)(−k)=k2x−kv0. This is a straight line in x with positive slope k2 and a negative intercept −kv0 at x=0, crossing zero at x=v0/k. The acceleration-distance graph is the straight line starting below the axis and rising with positive slope.
JEE Main · 2026 · 24 Jan 2026 · Shift 2 · Single correct option