JEE Main · 2020 · 09 Jan 2020 · Shift 2 · Solutions

WhatsApp Email
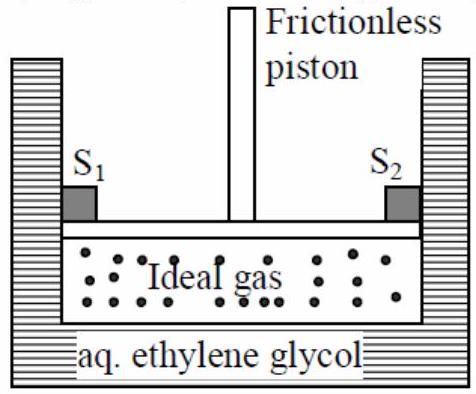
A Cylinder containing an ideal gas (0.1 mol of ) is in thermal equilibrium with a large volume of 0.5 molal aqueous solution of ethylene glycol at its freezing point. If the stoppers and (as shown in the figure) are suddenly withdrawn, the volume of the gas in litres after equilibrium is achieved will be____

(Given, (water)

Answer: 2.18

Solution

The gas is held at the freezing point of the ethylene glycol solution, which is depressed below by , so the temperature is . Confined to , the gas exerts . When the stoppers are withdrawn the gas expands isothermally against the surrounding , and Boyle's law gives the new volume .

JEE Main · 2020 · 09 Jan 2020 · Shift 2 · Numerical answer
More JEE Main questions on Solutions

  1. Elements P and Q form two types of non-volatile, non-ionizable compounds PQ and . When 1 g of PQ is dissolved in 50 g of solvent 'A', was 1.176 K while when 1 g of is dissolved in 50 g of solvent 'A', …
    JEE Main 2026View solution →
  2. Consider a solution of dissolved in water in a closed container.

    Which one of the following plots correctly represents variation of log (partial pressure of CO2 in vapour phase above water) [y-axis] with log (mole fraction of …
    JEE Main 2026View solution →
  3. Given below are two statements:

    Statement I: The Henry's law constant is constant with respect to variations in solution's concentration over the range for which the solutions is ideally dilute.
    Statement II : does not diff …
    JEE Main 2026View solution →
  4. The osmotic pressure of a living cell is 12 atm at 300 K. The strength of sodium chloride solution that is isotonic with the living cell at this temperature is . (Nearest integer)

    Given: …
    JEE Main 2026View solution →
  5. A substance 'X' (1.5 g) dissolved in 150 g of a solvent 'Y' (molar mass ) led to an elevation of the boiling point by 0.5 K. The relative lowering in the vapour pressure of the solvent 'Y' is . (Nearest integer)
    [Giv …
    JEE Main 2026View solution →
  6. Which one of the following graphs accurately represents the plot of partial pressure of vs its mole fraction in a mixture of acetone and at constant temperature ?
    JEE Main 2026View solution →