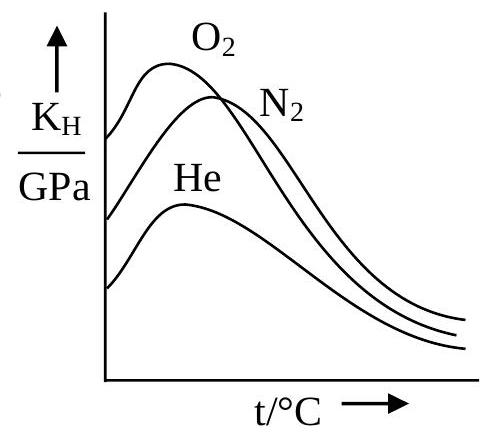
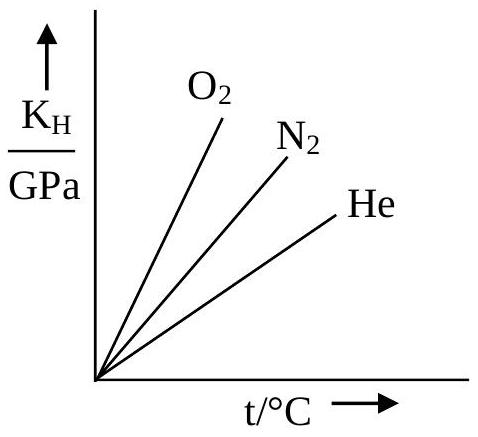
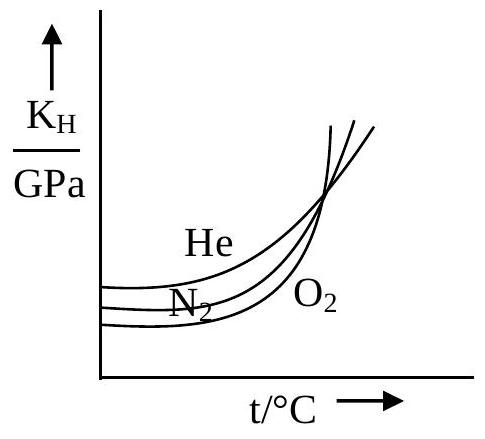
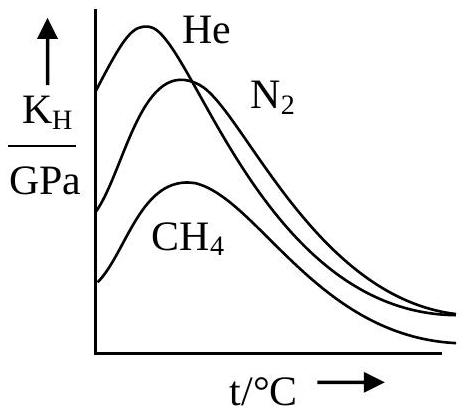
Which of the following graph correctly represents the plots of KH at 1 bar gases in water versus temperature?
(A)(see structure)
(B)(see structure)
(C)(see structure)
(D)(see structure)✓ Correct
Answer: (D)
Solution
Henry's constant KH is the pressure required to dissolve a gas, so it moves opposite to solubility. Warming the water drives dissolved gas out and KH climbs, but past a certain temperature solvent effects reverse this, so each curve rises to a maximum and then falls. A less soluble gas carries a larger KH; since the solubility order is CHX4>NX2>He, the constants rank in reverse at every temperature, He>NX2>CHX4. The correct plot is the family of curves each passing through a maximum with helium uppermost, nitrogen beneath it and methane lowest.
JEE Main · 2025 · 02 Apr 2025 · Shift 1 · Single correct option